Dairy is part of the daily diet of millions of people around the world. Yet behind every glass of milk, cup of yogurt, or piece of cheese is an environmental footprint that often goes unnoticed.
Food production accounts for roughly a third of global greenhouse gas emissions, and animal-based products tend to have significantly higher impacts than plant-based alternatives.
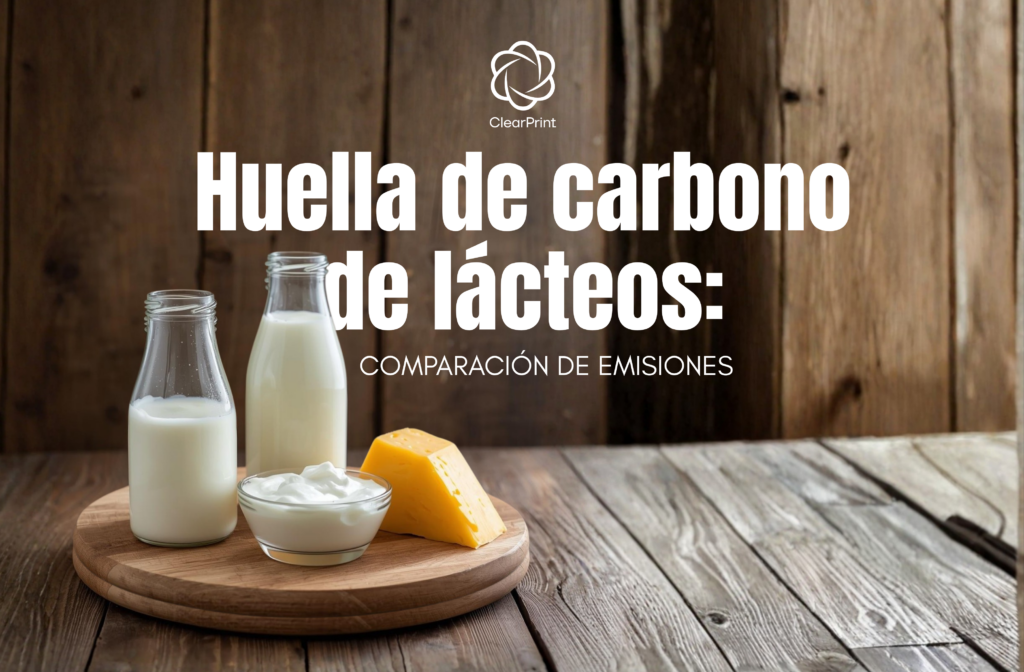
In this new ClearPrint ranking, we look at four everyday products: plant-based yogurt, regular yogurt, cow's milk, and cheese.
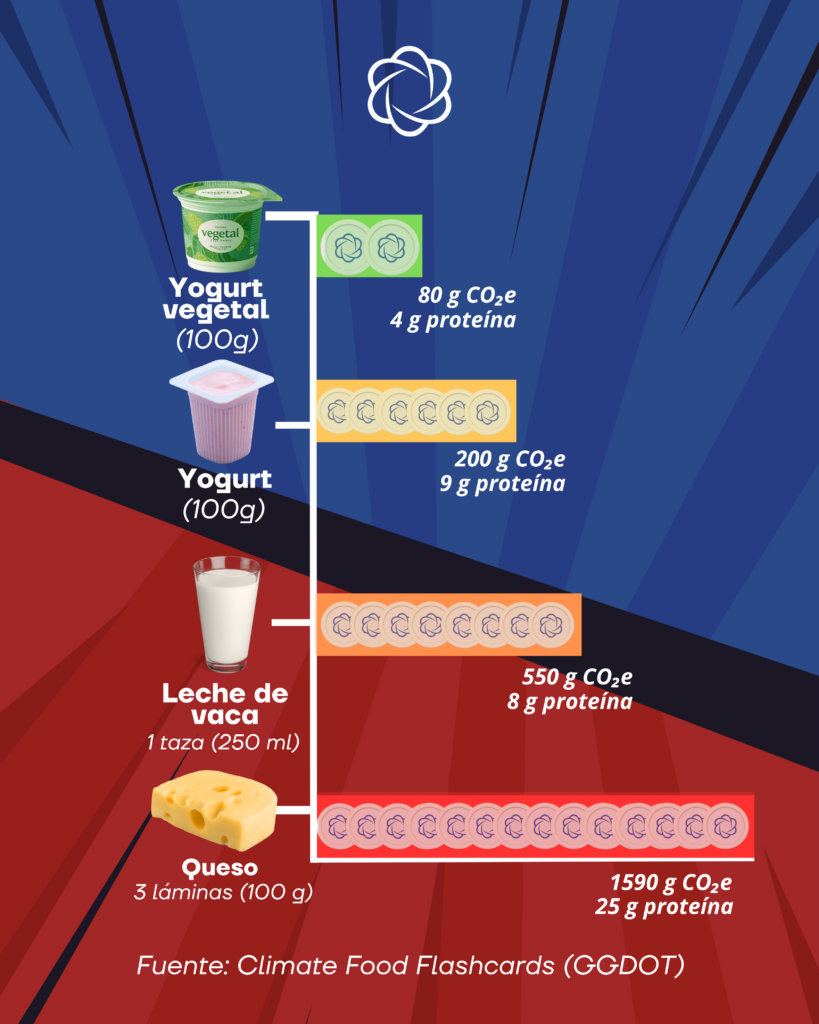
1st Place: Plant-Based Yogurt
Plant-based yogurt has the smallest carbon footprint in the ranking.
Its production doesn't involve raising animals or the methane emissions associated with livestock, one of the gases with the highest global warming potential. It also tends to require fewer resources, such as land and water, than conventional dairy.
Approximate footprint (100 g):
- 80 g CO₂e
- 4 g of protein
2nd Place: Regular Yogurt
Although it has a larger footprint than its plant-based counterpart, yogurt ranks among the lowest-impact dairy products in this category.
Since it's made from milk, it carries part of the emissions generated during livestock production.
Approximate footprint (100 g):
- 200 g CO₂e
- 9 g of protein
3rd Place: Cow's Milk
Cow's milk is one of the most widely consumed foods in the world and the basis for many dairy products. However, its production is linked to emissions from animal feed, land use, and enteric fermentation, a digestive process in cattle that releases methane.
Approximate footprint (1 cup / 250 ml):
- 550 g CO₂e
- 8 g of protein
4th Place: Cheese
Cheese has the largest carbon footprint in this ranking.
This is mainly due to the large amount of milk needed to make it. Depending on the type of cheese, several liters of milk may be required to produce just one kilogram of final product, concentrating the emissions generated throughout the entire production chain.
Approximate footprint (100 g):
- 1.590 g CO₂e
- 25 g of protein
What can we learn from this ranking?
The results show that even within the same food category, there are significant differences in emissions. Choosing plant-based alternatives when possible, diversifying protein sources, and knowing the carbon footprint of products can all contribute to more conscious, informed eating. It's not about cutting foods out of your diet, but about having the information to make better decisions. 🌎
Discover our news story: «The Carbon Footprint of Seafood: Comparing Emissions« and check out rankings for other proteins.
Want to know the carbon footprint of your products? Get in touch and find out how to measure and communicate the environmental impact of your food products.
Follow us on our Instagram so you don't miss any updates.
Sources: Our World in Data + Climate Food Flashcards. Reference values based on global averages.